
Read on for a specialist report from Our Rainwater on the rainwater harvesting performance of planters installed on Suffolk Churches as part of the Reclaim the Rain project.
Summary
In November 2025, six rainwater management planters were installed across St Mary’s Church, Friston, and St Mary’s Church, Little Blakenham. Each church also had one remote level monitor installed to measure the performance of one of the rainwater management planters. Nearly 1 full year of data has been recorded, and our analysis shows that, despite a year of considerable periods of drought, each planter managed tens of thousands of litres of rainfall runoff.
Rainfall data
Our recorded data span 334 days between 21st November 2025 and 27th October 2026
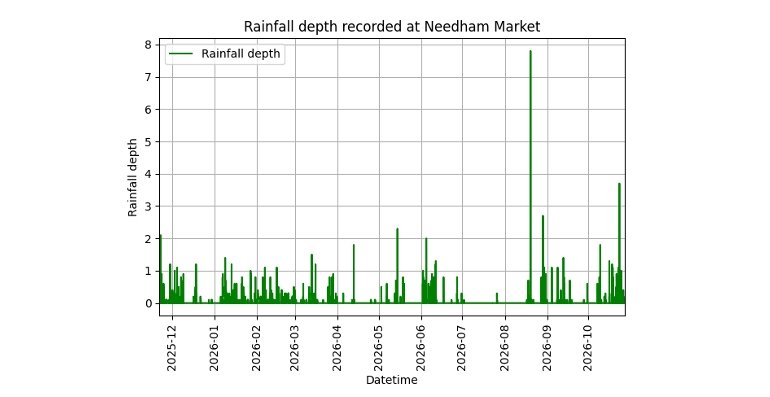
Figure 1: Rainfall hyetograph showing the rainfall depth recorded at Needham Market over the data collection period.
As I’m sure you will remember, we had a record-breakingly hot summer, with considerable periods with little or no rainfall. The Environment Agency’s nearby rain-gauge at Needham Market (see Figure 1) recorded a spell of over 24 days with no rainfall recorded whatsoever, and a 45-day spell where only 1mm of rain fell, causing the agency to declare the region to be in drought, and Anglian Water to issue temporary use bans.
Even so, over the monitoring period nearly 980mm of rainfall was recorded, which is well above the average annual rainfall depth of ~623mm (although this data has yet to be fully validated by the agency).
This sort of highly sporadic but heavy rainfall is exceptionally challenging for drainage networks, both natural and man-made. These conditions are also exactly what rainwater management planters are designed to help mitigate, by attenuating high runoff volumes over longer periods of time.
Catchment areas and intercepted rainfall runoff
To assess the amount of rainfall that each planter managed we need to know what catchment area drains into each. This was assessed using high resolution aerial imagery and terrain data.
For the planters being monitored the catchment areas and associated intercepted total rainfall volumes are:
St Mary’s Church, Friston – 30m2 catchment area, 29,400 litres of rainfall runoff intercepted
St Mary’s Church, Little Blakenham – 29m2 catchment area, 28,420 litres of rainfall runoff intercepted
Each planter therefore handled enough water to make up about 4,700 standard toilet flushes (or 7,100 “reduced volume” water saving toilet flushes), which is enough water to have around 300 baths or showers.
Planter performance
Water depth in the planters is measured at 15-minute intervals.
The maximum level measured in the planters at any time in the year was a water-depth of 0.5m. Due to the planter’s geometry this corresponds to storage of approximately 300L of water, with space remaining for approximately a further 200L.
The minimum level measured in the planters at any time in the year was a water-depth of 0.18m. This corresponds to storage of approximately 100L of water, which is stored at the very bottom of the planters and is used to ensure that plants always have a constant supply of water available to wick up through the soil to supply their roots.
By plotting a graph of the water-depth in the planters and the rainfall depth measured at the rain-gauge we can see how the planters respond to rain (see Figure 2).
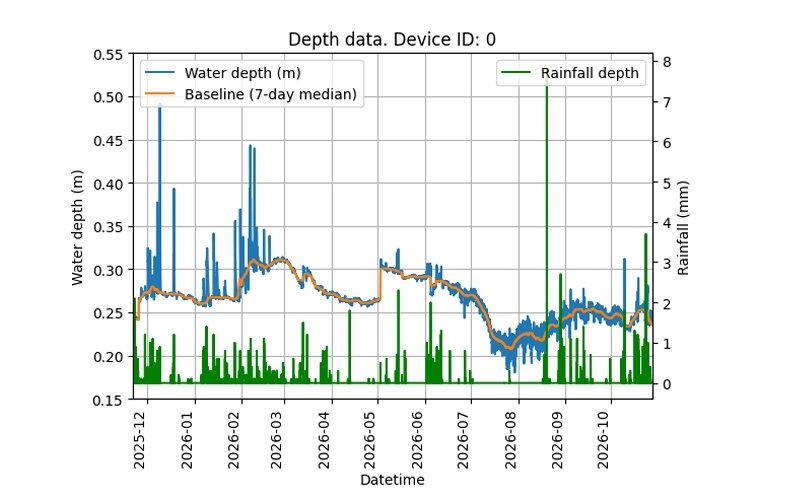
Figure 2: Graph of the water depth in the planter at Little Blakenham against the rainfall rate at Needham Market.
At the start of the monitoring period, we can see that the water-depth in the planter follows a very similar pattern to the rainfall rate, meaning that the planters are acting as intended and capturing water as it runs off the roof. However, they do not fall back to a consistent baseline, and instead the baseline fluctuates. This is because soil is very good at holding on to water, so the baseline water level at the base of the planter is much more stable.
We can remove the baseline from the water-depth measurements, known as de-trending, to get a better picture of how the water level in the planter responds to rainfall (see Figure 3).
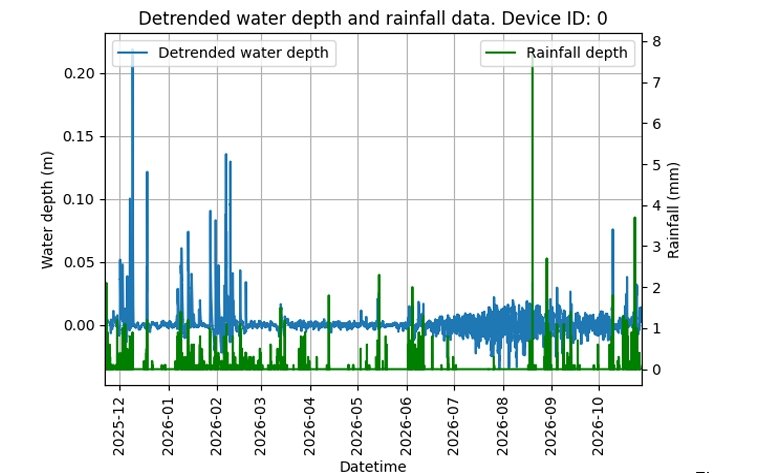
Figure 3: Detrended water-depth and rainfall depth timeseries.
Around March 2026 the water-level in the planter stops responding to rainfall as clearly. This is likely to be a result of the soil in the planter drying out, so the relatively minor rainfall events are not able to re-wet the soil, and rainfall is absorbed by the soil rather than meaningfully changing the water-depth at the base of the planter.
At the end of the very dry spell in August significant rainfall appears to re-wet the soil and the monitored water-depth again begins to reflect the behaviour of the rainfall, suggesting that the soil has re-wetted again and the attenuation behaviour is restored.
When it rains it takes time for rainfall to run off the roof, through the guttering, and percolate down through the soil layer in the planters. By measuring how far apart the rainfall and water-depth timeseries are we can estimate how long this takes. We do this using a cross-correlogram (see Figure 4) which shows how related the two timeseries are on the y-axis and how far apart they are on the x-axis
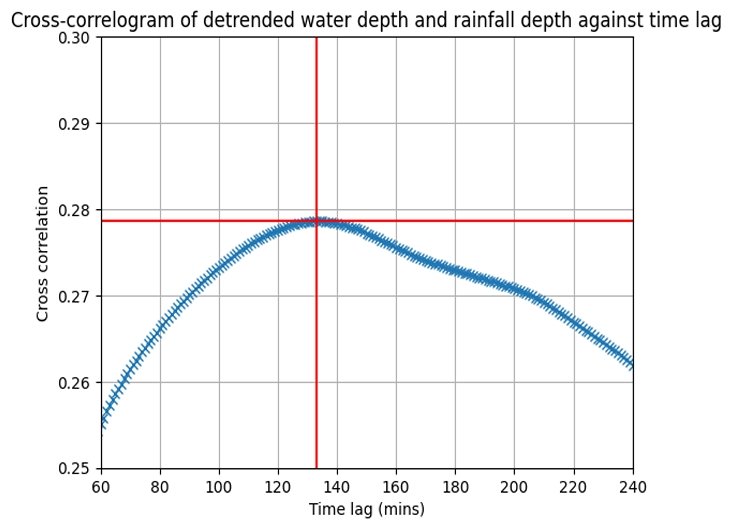
Figure 4: Cross-correlogram of detrended water depth and rainfall depth against time lag
Data from the monitors suggests a peak correlation of a little over two hours. However, some of this will be due to the distance between the rain gauge and the churches.
This gives us an indication of how much they are delaying the peak of storms, which protects drainage networks by stopping influxes of rainfall runoff all at once.
This report was written By Dr Ari Cooper-Davis, Technical Director at Our Rainwater.
Follow the link below to visit Our Rainwater’s website, to find out more about their work and the rainwater capture movement!